Performance Analysis
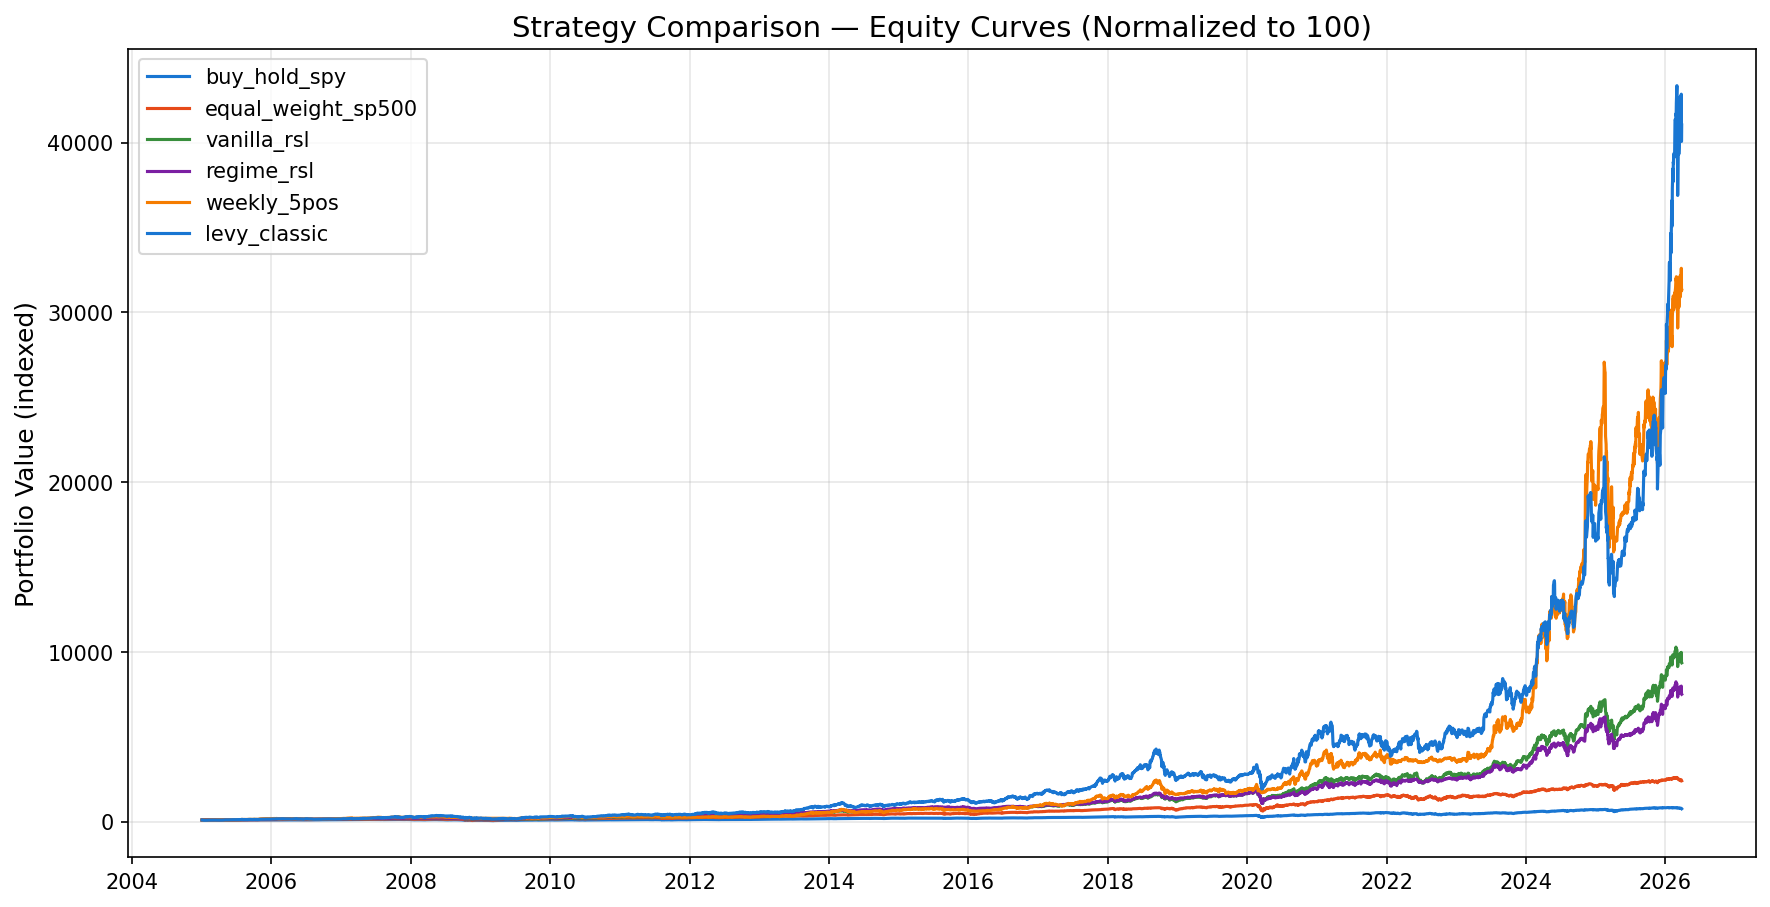
Equity Curves Comparison
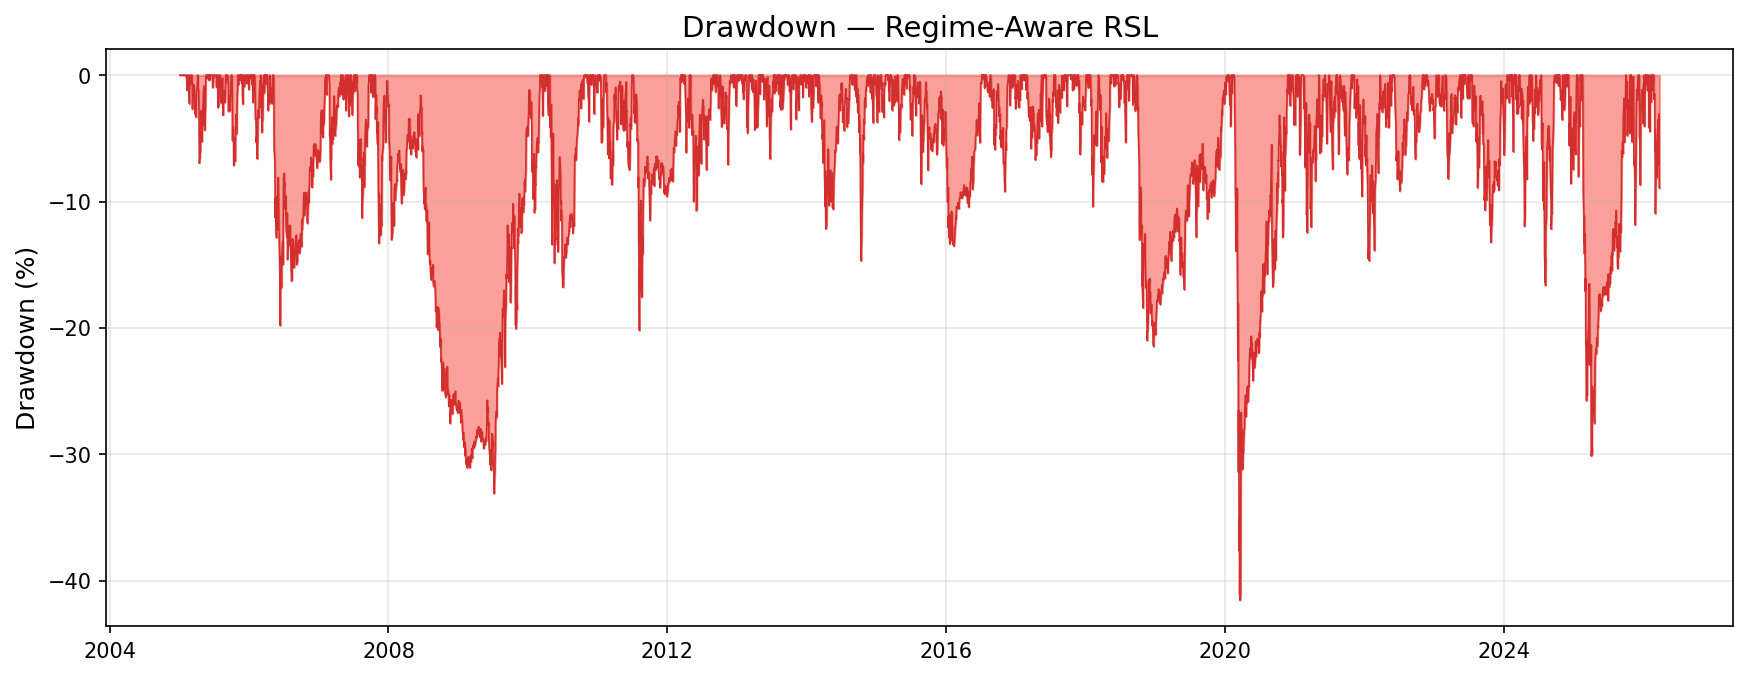
Drawdown — Regime RSL
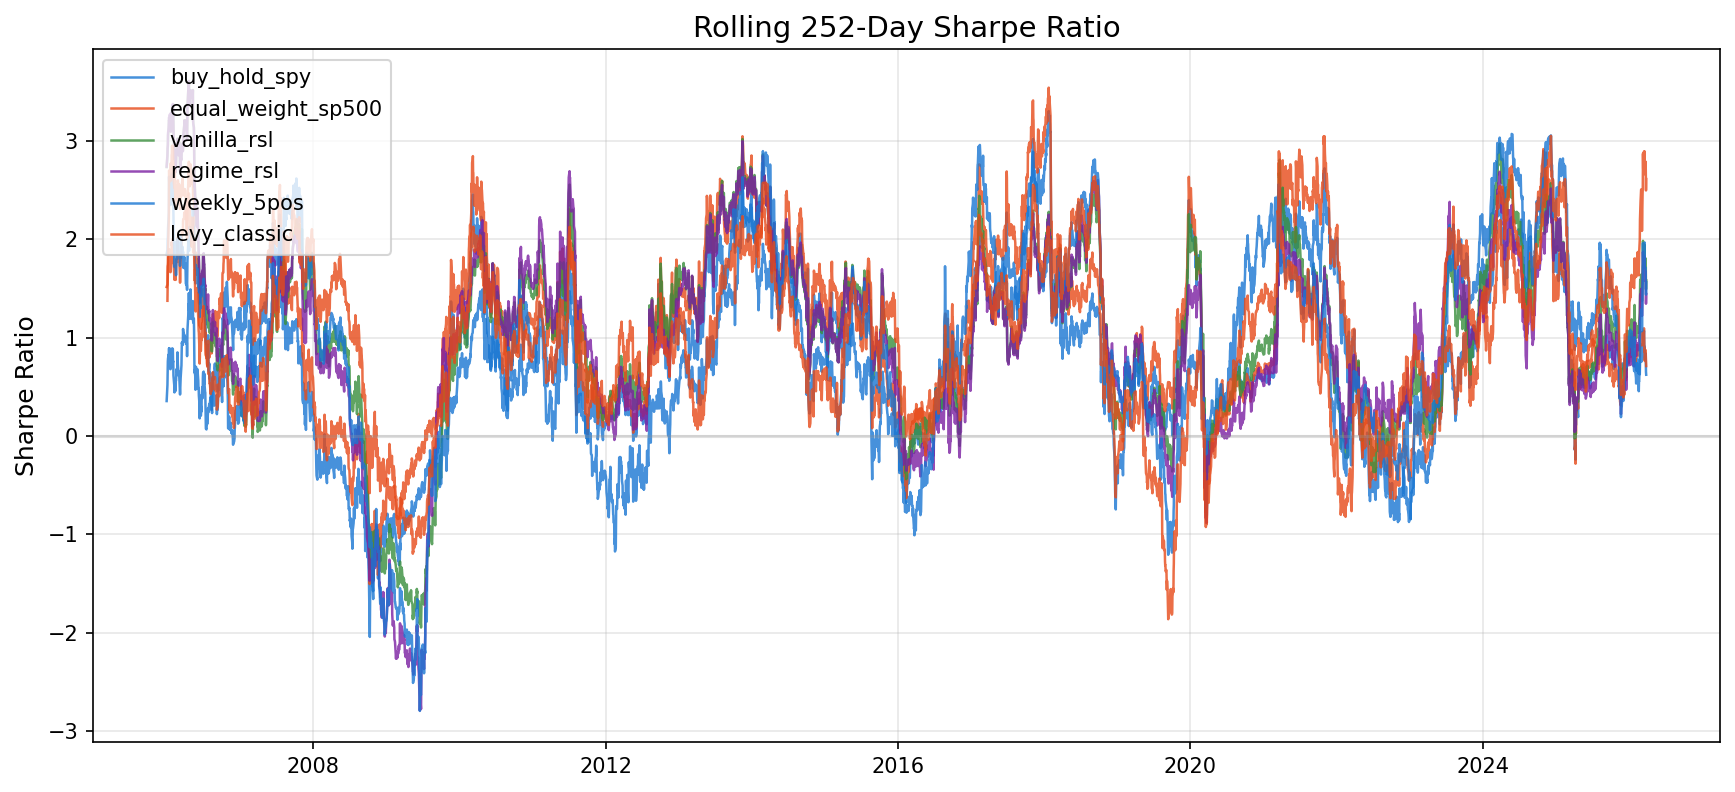
Rolling Sharpe Ratio
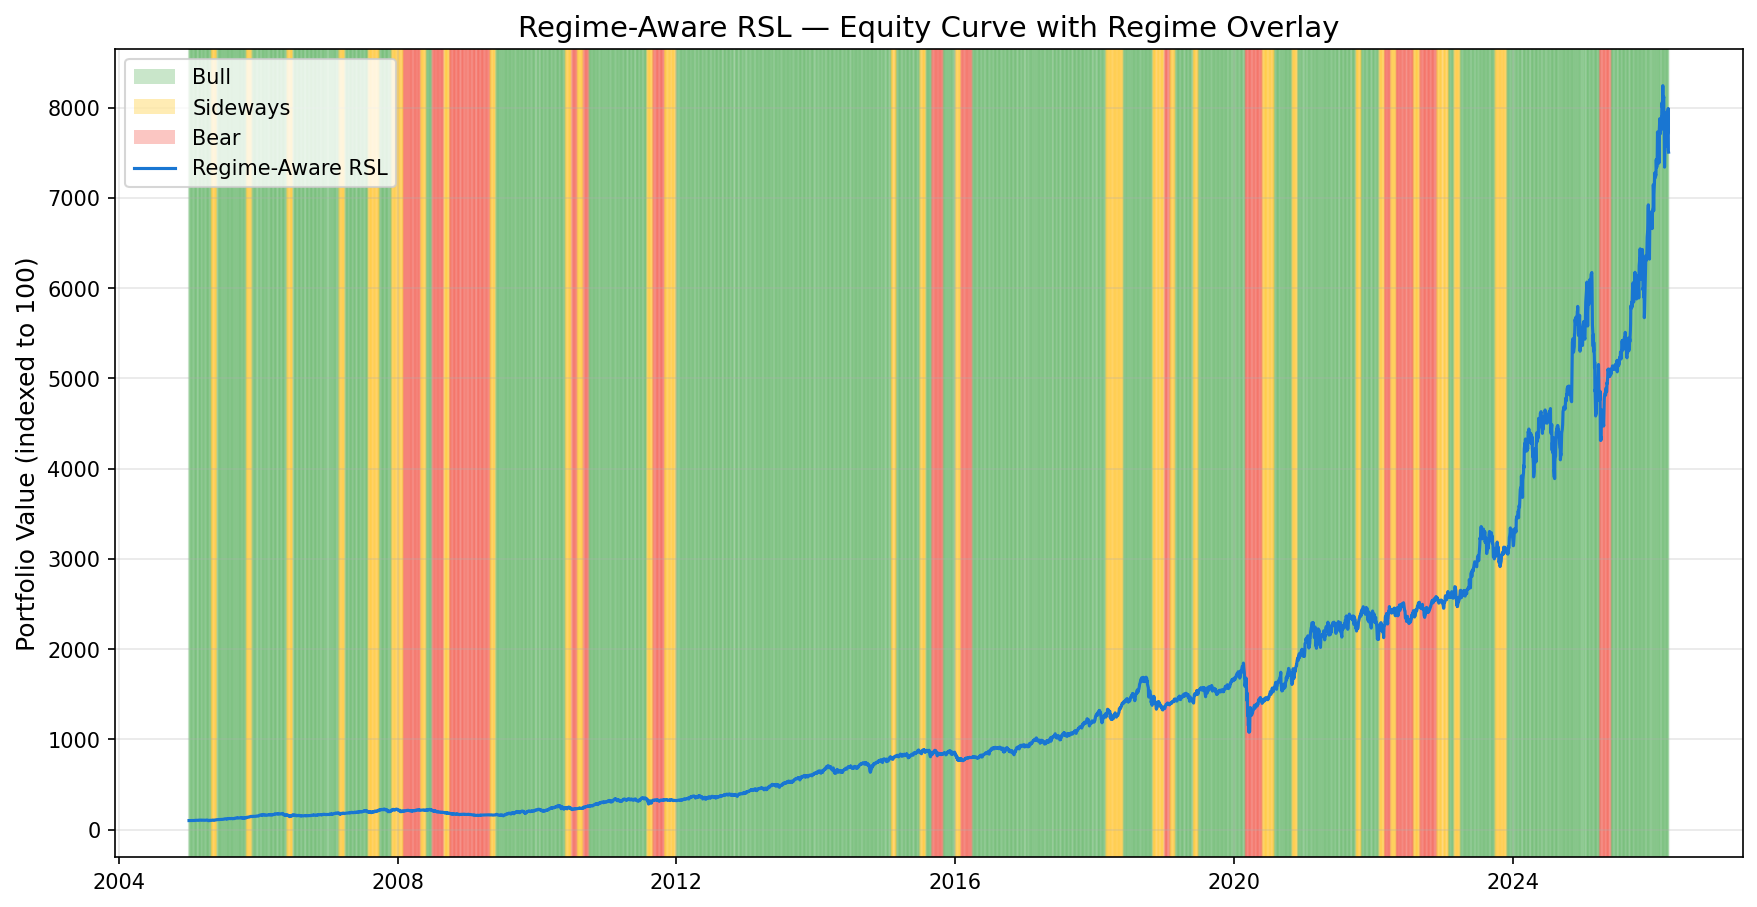
Equity with Regime Overlay
Performance Metrics Comparison
| Metric | levy_classic (#26) |
weekly_5pos (#25) |
regime_rsl (#24) |
vanilla_rsl (#23) |
equal_weight_sp500 (#22) |
buy_hold_spy (#21) |
|---|---|---|---|---|---|---|
| Cagr | 32.77% | 31.09% | 22.56% | 23.84% | 16.18% | 10.05% |
| Annual Volatility | 33.56% | 29.12% | 21.18% | 23.57% | 20.29% | 18.69% |
| Sharpe Ratio | 0.9551 | 1.0087 | 0.9744 | 0.9425 | 0.7397 | 0.4996 |
| Sortino Ratio | 1.2995 | 1.3653 | 1.2233 | 1.2011 | 0.9103 | 0.6119 |
| Max Drawdown | -56.74% | -41.31% | -41.55% | -44.92% | -50.69% | -54.24% |
| Calmar Ratio | 0.5776 | 0.7526 | 0.5430 | 0.5308 | 0.3191 | 0.1853 |
| Win Rate Monthly | 64.31% | 60.00% | 67.06% | 66.67% | 67.06% | 66.27% |
| Avg Monthly Return | 2.79% | 2.61% | 1.83% | 1.96% | 1.36% | 0.89% |
| Best Month | 32.91% | 42.57% | 18.31% | 19.00% | 17.43% | 12.59% |
| Worst Month | -30.55% | -28.34% | -18.23% | -18.13% | -18.29% | -16.14% |
| Annual Turnover | 663.75% | 1,992.49% | 745.48% | 795.64% | 0.00% | 0.00% |
| Total Return | 40,940.94% | 31,215.07% | 7,405.80% | 9,256.89% | 2,309.74% | 663.25% |